 EMVIC 2012
The First Eye Movements' Verification and Identification Competition for BTAS 2012 Conference
EMVIC 2012There are four datasets available to download. Datasets A and B are stored in EMD1 format and datasets C and D in EMD2 format. Participants should send their results for every dataset separately. It is not neccessary to use all datasets.
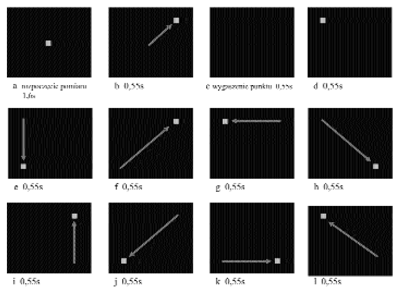
Dataset A consists of 978 samples from 37 subjects. Samples were taken with 250Hz frequency using Ober2 eye tracker. As it was 2048 measures taken, the whole measurements lasted 8192 ms. There was a jumping point on 3x3 matrix used as stimulus. The stimulus consists of eleven point position changes giving twelve consecutive point positions. First point appears in the middle of the screen and the person should look at it with eyes positioned directly ahead. After 1600 ms the point in the middle disappears and for 20 ms a screen is blank. In that time eyes are in instable state waiting for another point of interest. Then the point appears in the upper right corner. The flashing point on the blank screen attracts eyes attention even without the person's will. The 'jumps' of the point continue until the last point position in the middle of the screen is reached.
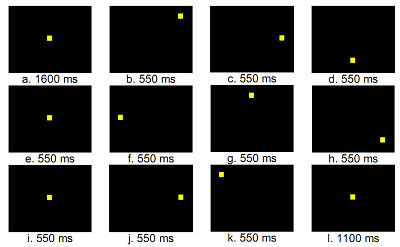
Dataset B consists of 4168 samples from 75 subjects. Samples were taken with 250Hz frequency using Ober2 eye tracker. As it was 2048 measures taken, the whole measurements lasted 8192 ms. There was a jumping point on 2x2 matrix used as stimulus. Points position changed after every 550 ms. Additionally there was 550 ms "break" with no point (black screen) in the middle of stimulation.
As the easiness of data acquisition was the main factor, no calibration was done to the device prior to measurement. That is why amplitudes of signals are different for different samples, different eyes and different axes. However, it is possible to perform post-calibration because we know where the subject should look at every moment. Some examples of post-calibration methods may be found in [Kasprowski 2004, section 5.1 and 5.2]. Samples with obvious errors (like saturation) were removed from datasets, however you may find some samples in dataset B for which (due to device failure) values for vertical position of right eye (RY) are missing (there are values, but no eye reaction is registered). Neverthless these samples may be valuable (you may for instance try to use left eye information only).
Dataset C consists of the data from 29 subjects. Each subject participated in four recording sessions. The first two recordings for each subject were conducted during the same day with an interval of approximately 15 minutes; two more recording were conducted one week later during a single day with an interval of approximately 15 minutes. For each recording session the stimulus was displayed on a 30 inch LCD screen as a vertical jumping dot, consisting of a grey disc sized approximately 1o with a small black point in the center. The dot performed 120 vertical jumps with amplitude of 20 degrees of the visual angle. See the video for stimuli.
All recordings were done by an Eye Link 1000 eye tracker at the sampling rate of 1000Hz. Chin rest was employed to stabilize subjects' heads during the recording.
Standard nine-point calibration procedure provided by the Eye Link vendor was performed prior to each recording. Average calibration error prior to each recording was 0.73 (numbers here and thereafter are combined for training and test data) degrees of the visual angle (SD=0.39), average dataloss during a recording was 2.88% (SD=0.04%). Average behavioral scores as defined in Komogortsev et al. (2010) when the raw eye positional data is separated into the fixations and saccades by the I-VT algorithm with a threshold of 70o/s are: SQnS=107.90% (SD=62%), FQnS=59.05% (SD=9%), and the FQlS=1.11o (SD=0.42o).
Dataset D consists of the data from 27 subjects. Each subject participated in four recording sessions. The first two recordings for each subject were conducted during the same day with an interval of approximately 15 minutes; two more recording were conducted one week later during a single day with an interval of approximately 15 minutes. For each recording session the stimulus was displayed on a 30 inch LCD screen as a jumping dot, consisting of a grey disc sized approximately 1o with a small black point in the center. During each recording session the dot appeared 100 times each time at random with only requirement that at the end of the 100 appearances the spatial placement of the dots on the screen would be close to uniform. See the video for stimuli.
Same hardware setup as for Dataset C was employed.
Standard nine-point calibration procedure provided by the Eye Link vendor was performed prior to each recording. Average calibration error prior to each recording was 0.75 (numbers here and thereafter are combined for training and test data) degrees of the visual angle (SD=0.55), average dataloss during a recording was 2.41% (SD=0.04%). Average behavioral scores as defined in Komogortsev et al. (2010) when the raw eye positional data is separated into the fixations and saccades by the I-VT algorithm with a threshold of 70o/s are: SQnS=116.29% (SD=31%), FQnS=64.59% (SD=8%), and the FQlS=1.38o (SD=0.33o).
The datasets A and B were collected at Silesian University of Technology, Poland by Dr. Paweł Kasprowski and Dr. Robert Brzeski (thanks to Robert for permission to publish his data!). Datasets C and D were collected at Texas State University-San Marcos by Dr. Oleg Komogortsev and Dr. Alex Karpov. Collection of data was in part supported by a grant from the National Institute of Standards #60NANB10D213 and grants from Texas State University.
All data is published for purpose of competition only. However, if you intend to use the data in your future research you may do it only if the databases are acknowledged with the following reference:
For datasets A and B:
For datases C and D:
Please register (using Registration link) and you should be able to download all datasets from here.